
VOTED "BEST PROPERTY MANAGEMENT COMPANY"
WHAT IS THE CURRENT MARKET CONDITIONS TO SELL MY PROPERTY?
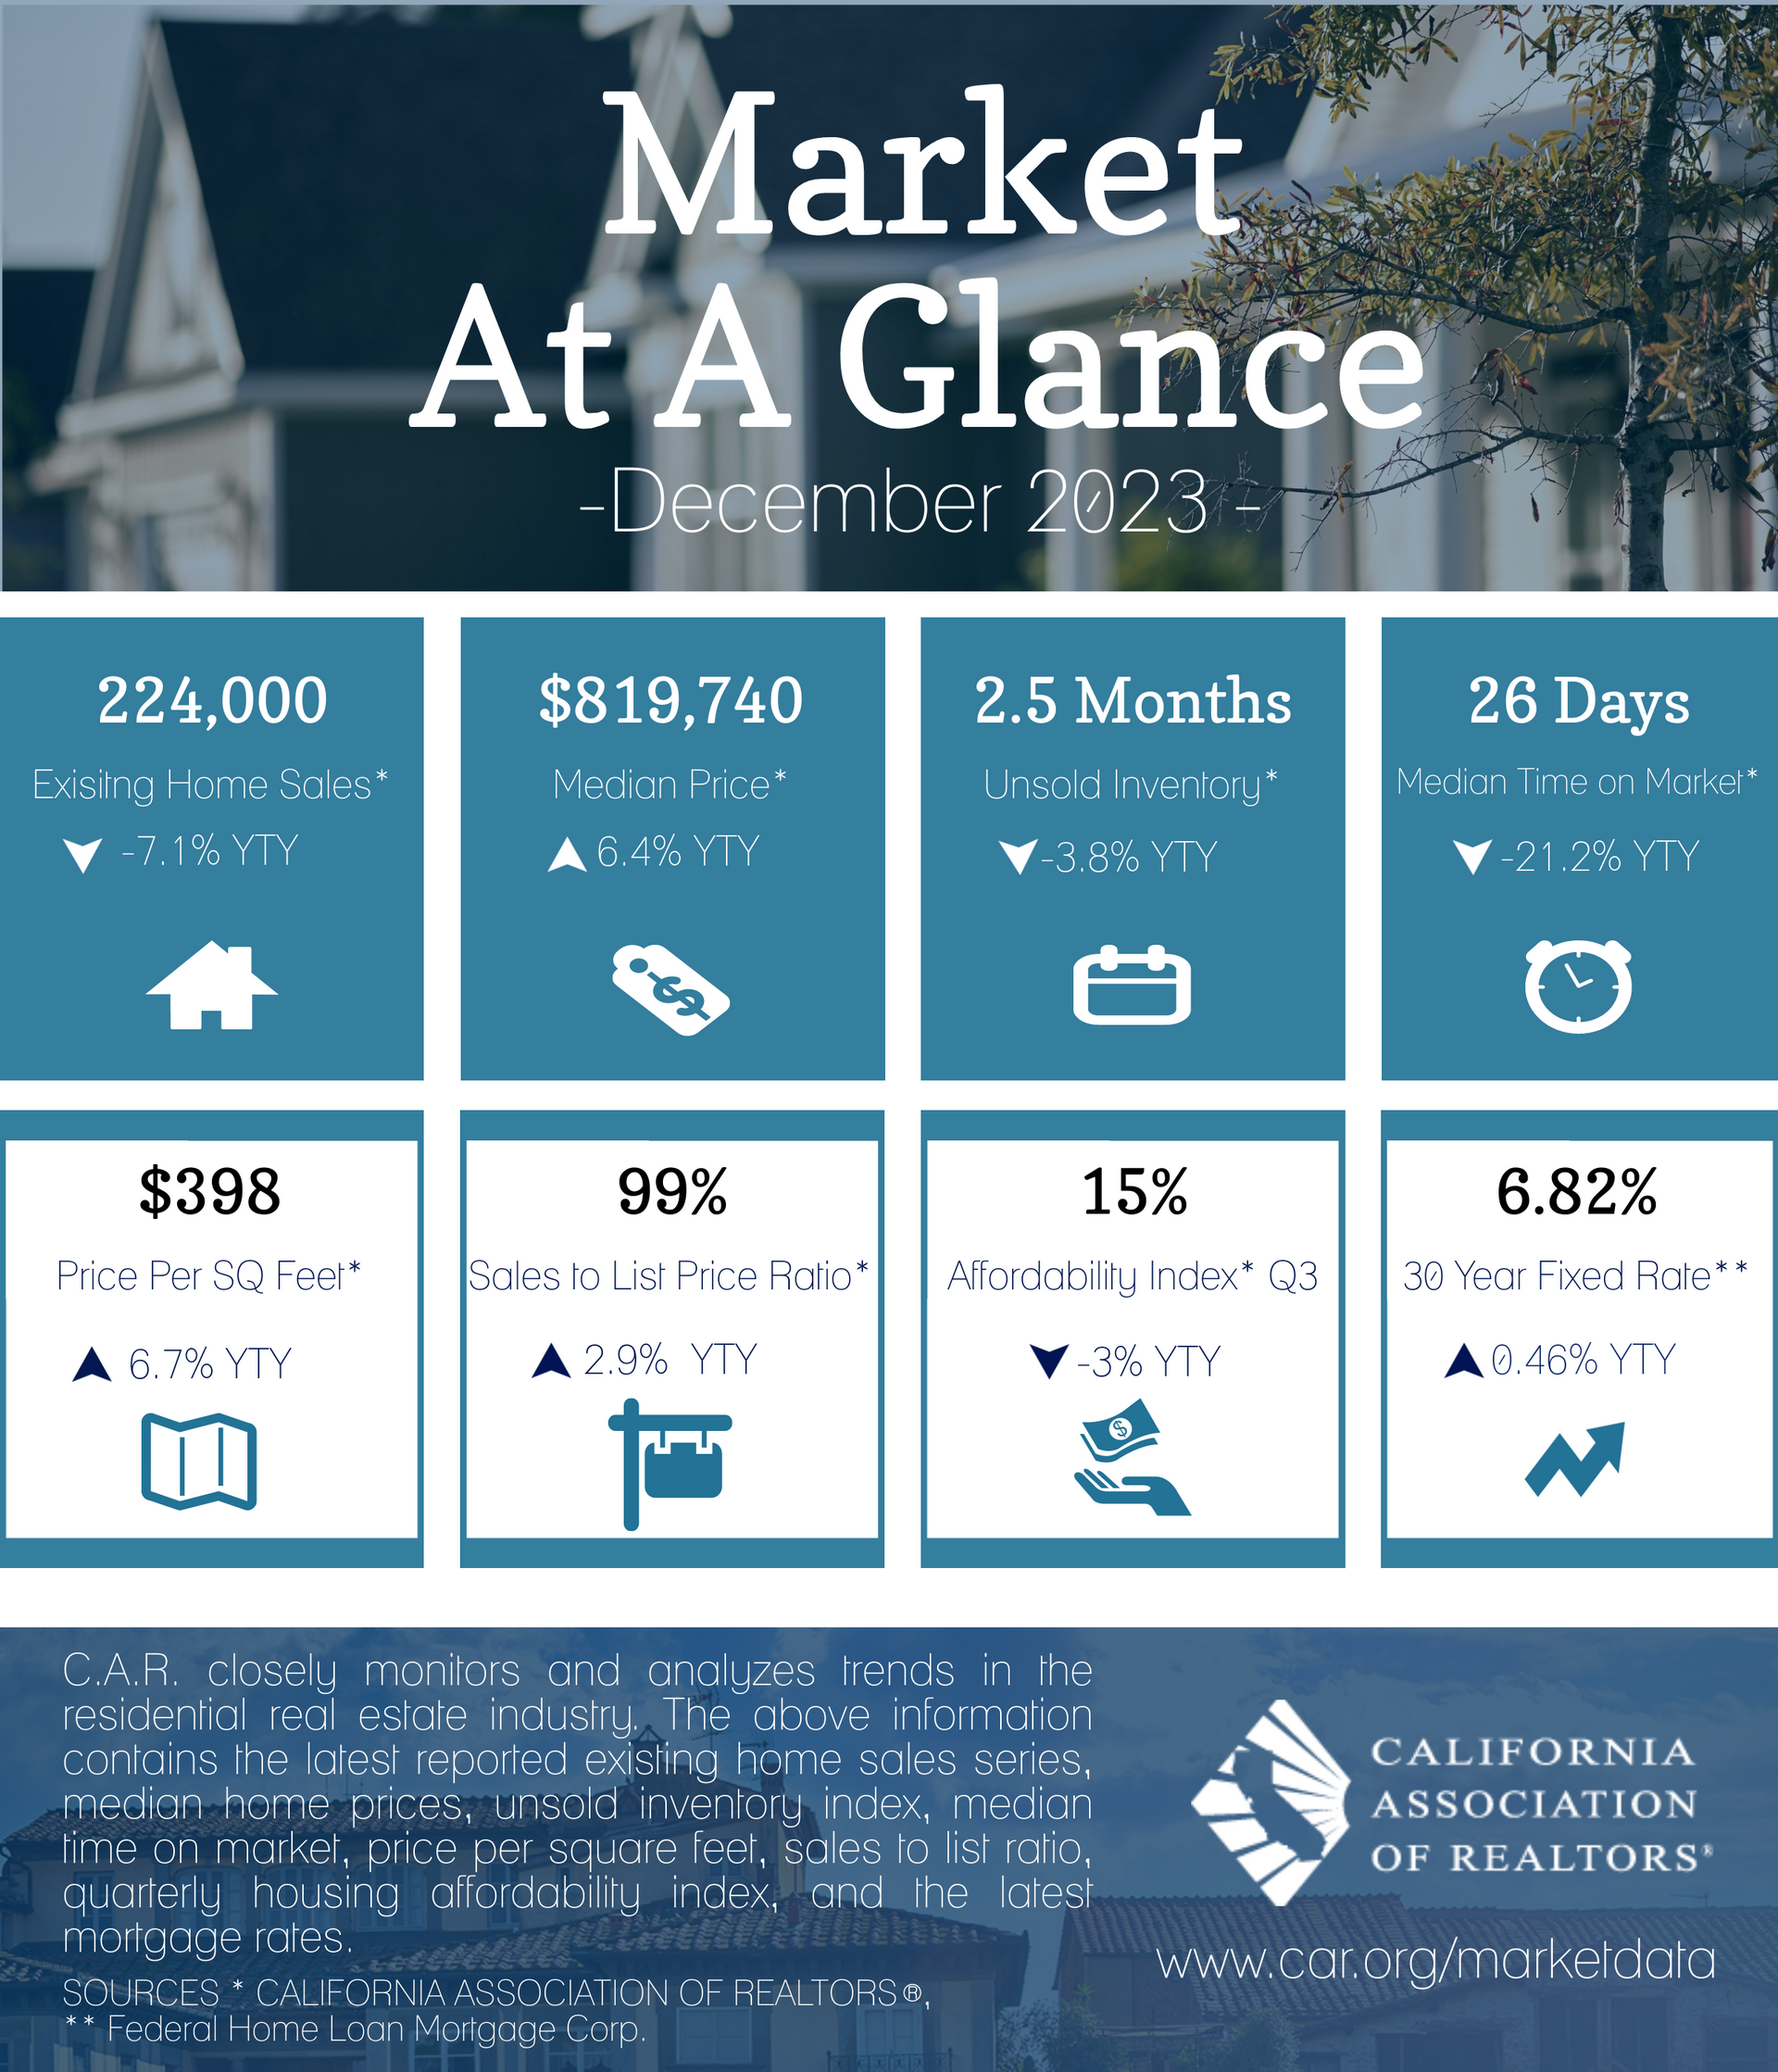
The Market at a Glance
August 15, 2019
California home sales perk up in July for first time in more than a year, C.A.R. reports
– Existing, single-family home sales totaled 411,630 in July on a seasonally adjusted annualized rate, up 5.6 percent from June and up 1.1 percent from July 2018.
– July’s statewide median home price was $607,990, down 0.4 percent from June and up 2.8 percent from July 2018.
– Year-to-date statewide home sales were down 4.9 percent in July.
LOS ANGELES (Aug. 15) – The lowest mortgage interest rates in nearly three years helped jump start California’s housing market to post the first year-over-year sales gain and highest sales level in 15 months, the CALIFORNIA ASSOCIATION OF REALTORS ® (C.A.R.) said today.
Closed escrow sales of existing, single-family detached homes in California totaled a seasonally adjusted annualized rate of 411,630 units in July, according to information collected by C.A.R. from more than 90 local REALTOR ® associations and MLSs statewide. The statewide annualized sales figure represents what would be the total number of homes sold during 2019 if sales maintained the July pace throughout the year. It is adjusted to account for seasonal factors that typically influence home sales.
July’s sales figure was up 5.6 percent from the 389,730 level in June and up 1.1 percent from home sales in July 2018 of 407,030.
“Mortgage rates that dipped to the lowest level in nearly three years has helped reduce monthly mortgage payments for the past five consecutive months, giving buyers more purchasing power,” said C.A.R. President Jared Martin. “The boost in demand gave the housing market its first yearly gain since April 2018.”
After setting record prices for the past three months straight, the median price pulled back from June’s $610,720 but still registered higher than the previous year. July’s median price was $607,990, down 0.4 percent from June and up 2.8 percent from $591,230 in July 2018, marking the fourth straight month that the median price remained above $600,000.
“While it’s encouraging that home sales crept higher in July, the market will continue to be challenged by an overarching affordability issue, especially in high cost areas such as the Bay Area, which requires a minimum annual income well into the six figures to purchase a home,” said C.A.R. Senior Vice President and Chief Economist Leslie Appleton-Young.
Other key points from C.A.R.’s July 2019 resale housing report include:
Note: The County MLS median price and sales data in the tables are generated from a survey of more than 90 associations of REALTORS ® throughout the state and represent statistics of existing single-family detached homes only. County sales data are not adjusted to account for seasonal factors that can influence home sales. Movements in sales prices should not be interpreted as changes in the cost of a standard home. The median price is where half sold for more and half sold for less; medians are more typical than average prices, which are skewed by a relatively small share of transactions at either the lower-end or the upper-end. Median prices can be influenced by changes in cost, as well as changes in the characteristics and the size of homes sold. The change in median prices should not be construed as actual price changes in specific homes.
*Sales-to-list-price ratio is an indicator that reflects the negotiation power of home buyers and home sellers under current market conditions. The ratio is calculated by dividing the final sales price of a property by its last list price and is expressed as a percentage. A sales-to-list ratio with 100 percent or above suggests that the property sold for more than the list price, and a ratio below 100 percent indicates that the price sold below the asking price.
**Price per square foot is a measure commonly used by real estate agents and brokers to determine how much a square foot of space a buyer will pay for a property. It is calculated as the sale price of the home divided by the number of finished square feet. C.A.R. currently tracks price-per-square foot statistics for 50 counties.
Leading the way…® in California real estate for more than 110 years, the CALIFORNIA ASSOCIATION OF REALTORS® ( www.car.org ) is one of the largest state trade organizations in the United States with more than 200,000 members dedicated to the advancement of professionalism in real estate. C.A.R. is headquartered in Los Angeles.
# # #
July 2019 County Sales and Price Activity
(Regional and condo sales data not seasonally adjusted)
| July 2019 | Median Sold Price of Existing Single-Family Homes | Sales | |||||||
| State/Region/County | July 2019 | June 2019 | July 2018 | Price MTM% Chg | Price YTY% Chg | Sales MTM% Chg | Sales YTY% Chg | ||
| Calif. Single-family homes | $607,990 | $610,720 | r | $591,230 | r | -0.4% | 2.8% | 5.6% | 1.1% |
| Calif. Condo/Townhomes | $470,000 | $480,000 | $485,000 | r | -2.1% | -3.1% | 5.3% | -2.5% | |
| Los Angeles Metro Area | $550,000 | $545,000 | $535,000 | 0.9% | 2.8% | 0.7% | 4.0% | ||
| Central Coast | $685,000 | $699,000 | $700,000 | -2.0% | -2.1% | -0.9% | 5.0% | ||
| Central Valley | $345,250 | $340,000 | $328,250 | 1.5% | 5.2% | 6.5% | 5.2% | ||
| Inland Empire | $380,000 | $379,000 | $365,000 | 0.3% | 4.1% | 1.5% | 2.4% | ||
| San Francisco Bay Area | $950,000 | $960,000 | $980,000 | -1.0% | -3.1% | 1.2% | -0.6% | ||
| San Francisco Bay Area | |||||||||
| Alameda | $950,000 | $960,000 | $970,000 | -1.0% | -2.1% | -3.5% | -10.5% | ||
| Contra Costa | $660,000 | $698,000 | $680,000 | -5.4% | -2.9% | 1.9% | -5.0% | ||
| Marin | $1,257,000 | $1,370,000 | $1,325,000 | -8.2% | -5.1% | -6.1% | 12.6% | ||
| Napa | $685,000 | $705,750 | $727,000 | -2.9% | -5.8% | 0.8% | 8.7% | ||
| San Francisco | $1,600,000 | $1,762,500 | $1,650,000 | -9.2% | -3.0% | 15.6% | 10.1% | ||
| San Mateo | $1,562,500 | $1,620,000 | $1,610,000 | -3.5% | -3.0% | -1.8% | -3.0% | ||
| Santa Clara | $1,298,000 | $1,350,000 | $1,351,000 | -3.9% | -3.9% | 3.9% | 3.9% | ||
| Solano | $465,000 | $448,000 | $454,000 | 3.8% | 2.4% | 4.7% | 4.9% | ||
| Sonoma | $655,000 | $662,500 | $650,000 | -1.1% | 0.8% | 2.2% | 10.0% | ||
| Southern California | |||||||||
| Los Angeles | $611,230 | $599,680 | $597,520 | 1.9% | 2.3% | -4.5% | 4.7% | ||
| Orange | $839,450 | $842,000 | $829,000 | -0.3% | 1.3% | 8.8% | 6.7% | ||
| Riverside | $420,000 | $420,000 | $408,000 | 0.0% | 2.9% | -0.5% | 0.8% | ||
| San Bernardino | $312,000 | $310,000 | $292,000 | 0.6% | 6.8% | 4.8% | 5.0% | ||
| San Diego | $650,000 | $665,000 | $650,000 | -2.3% | 0.0% | 8.9% | 3.4% | ||
| Ventura | $685,000 | $647,000 | $662,360 | 5.9% | 3.4% | 6.3% | 2.1% | ||
| Central Coast | |||||||||
| Monterey | $651,780 | $640,500 | $655,500 | 1.8% | -0.6% | 10.8% | 4.6% | ||
| San Luis Obispo | $625,000 | $640,000 | $650,000 | -2.3% | -3.8% | 2.5% | 21.4% | ||
| Santa Barbara | $695,000 | $717,000 | $550,000 | -3.1% | 26.4% | -11.2% | 2.5% | ||
| Santa Cruz | $899,500 | $897,000 | $898,000 | 0.3% | 0.2% | -4.9% | -15.2% | ||
| Central Valley | |||||||||
| Fresno | $284,400 | $283,000 | $280,000 | 0.5% | 1.6% | 2.6% | 4.8% | ||
| Glenn | $268,750 | $250,000 | $235,000 | 7.5% | 14.4% | -17.6% | -17.6% | ||
| Kern | $263,000 | $259,450 | $250,000 | 1.4% | 5.2% | 15.6% | 8.3% | ||
| Kings | $254,750 | $247,150 | $224,980 | r | 3.1% | 13.2% | -17.9% | -5.9% | |
| Madera | $297,500 | $291,250 | $250,000 | 2.1% | 19.0% | -3.9% | 17.9% | ||
| Merced | $283,000 | $287,000 | $267,450 | -1.4% | 5.8% | 20.4% | 7.8% | ||
| Placer | $496,250 | $525,000 | $495,000 | -5.5% | 0.3% | 1.7% | 12.2% | ||
| Sacramento | $390,000 | $390,000 | $370,000 | 0.0% | 5.4% | 10.8% | 4.5% | ||
| San Benito | $570,000 | $585,500 | $626,500 | -2.6% | -9.0% | -11.7% | 15.2% | ||
| San Joaquin | $380,000 | $386,750 | $370,000 | -1.7% | 2.7% | 5.2% | 2.3% | ||
| Stanislaus | $335,000 | $325,500 | $325,000 | 2.9% | 3.1% | 16.4% | 5.7% | ||
| Tulare | $245,000 | $247,500 | $239,000 | -1.0% | 2.5% | -7.3% | -5.6% | ||
| Other Calif. Counties | |||||||||
| Amador | $312,500 | $320,000 | r | $327,000 | r | -2.3% | -4.4% | -35.2% | -23.3% |
| Butte | $374,280 | $384,000 | $315,000 | -2.5% | 18.8% | 9.8% | 7.3% | ||
| Calaveras | $325,500 | $330,000 | $330,000 | -1.4% | -1.4% | 29.7% | 12.4% | ||
| Del Norte | $275,000 | $353,500 | $210,000 | -22.2% | 31.0% | 6.3% | -26.1% | ||
| El Dorado | $510,500 | $497,500 | $504,000 | 2.6% | 1.3% | 8.5% | -10.7% | ||
| Humboldt | $334,370 | $340,000 | $310,000 | -1.7% | 7.9% | 11.0% | 9.2% | ||
| Lake | $249,000 | $270,000 | $249,950 | -7.8% | -0.4% | 18.1% | 28.9% | ||
| Lassen | $225,000 | $215,000 | $185,000 | 4.7% | 21.6% | -8.0% | -30.3% | ||
| Mariposa | $281,400 | $354,500 | $327,750 | -20.6% | -14.1% | -18.8% | 8.3% | ||
| Mendocino | $395,000 | $399,000 | $393,750 | -1.0% | 0.3% | -10.2% | -14.5% | ||
| Mono | $692,500 | $910,000 | $899,500 | -23.9% | -23.0% | -20.0% | 0.0% | ||
| Nevada | $445,000 | $427,500 | $419,500 | 4.1% | 6.1% | -1.5% | -2.9% | ||
| Plumas | $280,000 | $340,000 | $290,000 | -17.6% | -3.4% | -2.6% | -15.6% | ||
| Shasta | $286,000 | $289,900 | $280,000 | -1.3% | 2.1% | 11.3% | 7.4% | ||
| Siskiyou | $210,000 | $270,250 | $223,000 | -22.3% | -5.8% | 20.5% | 10.4% | ||
| Sutter | $315,000 | $313,000 | $294,500 | 0.6% | 7.0% | 13.3% | 21.4% | ||
| Tehama | $255,000 | $260,000 | $223,000 | -1.9% | 14.3% | 24.4% | 54.5% | ||
| Tuolumne | $300,000 | $297,000 | $315,000 | 1.0% | -4.8% | 28.6% | 1.1% | ||
| Yolo | $485,000 | $463,500 | $430,000 | 4.6% | 12.8% | 4.5% | 8.8% | ||
| Yuba | $299,900 | $295,000 | $289,000 | 1.7% | 3.8% | 12.7% | -6.3% | ||
r = revised
NA = not available
July 2019 County Unsold Inventory and Days on Market
(Regional and condo sales data not seasonally adjusted)
| July 2019 | Unsold Inventory Index | Median Time on Market | ||||||||
| State/Region/County | July 2019 | June 2019 | July 2018 | July 2019 | June 2019 | July 2018 | ||||
| Calif. Single-family homes | 3.2 | 3.4 | 3.3 | 21.0 | 19.0 | 18.0 | ||||
| Calif. Condo/Townhomes | 2.9 | 3.1 | 2.7 | 21.0 | 21.0 | 16.0 | ||||
| Los Angeles Metro Area | 3.5 | 3.7 | 3.7 | 26.0 | 24.0 | 23.0 | ||||
| Central Coast | 4.1 | 4.0 | 4.2 | 22.0 | 21.0 | 20.0 | ||||
| Central Valley | 2.7 | 2.9 | 3.0 | 15.0 | 14.0 | 15.0 | ||||
| Inland Empire | 3.6 | 3.7 | 3.9 | 32.0 | 31.0 | 29.0 | ||||
| San Francisco Bay Area | 2.5 | 2.5 | 2.2 | 18.0 | 16.0 | 15.0 | ||||
| San Francisco Bay Area | ||||||||||
| Alameda | 2.0 | 1.9 | 1.7 | 14.0 | 13.0 | 13.0 | ||||
| Contra Costa | 2.3 | 2.4 | 2.0 | 14.0 | 13.0 | 14.0 | ||||
| Marin | 2.7 | 2.8 | 2.9 | 30.0 | 27.0 | 24.0 | ||||
| Napa | 4.7 | 4.8 | 4.4 | 42.0 | 41.5 | 44.0 | ||||
| San Francisco | 1.4 | 2.0 | 1.6 | 14.0 | 13.0 | 15.0 | ||||
| San Mateo | 1.9 | 1.9 | 1.6 | 13.0 | 13.0 | 12.0 | ||||
| Santa Clara | 2.3 | 2.5 | 2.2 | 14.0 | 12.0 | 11.0 | ||||
| Solano | 2.8 | 2.9 | 2.8 | 33.0 | 33.0 | 32.0 | ||||
| Sonoma | 3.8 | 3.8 | 3.9 | 38.0 | 35.0 | 36.0 | ||||
| Southern California | ||||||||||
| Los Angeles | 3.2 | 3.4 | 3.5 | 21.0 | 19.0 | 18.0 | ||||
| Orange | 3.5 | 3.8 | 3.5 | 24.0 | 20.0 | 19.0 | ||||
| Riverside | 3.5 | 3.6 | 3.6 | 32.0 | 32.0 | 28.0 | ||||
| San Bernardino | 3.8 | 4.0 | 4.3 | 32.0 | 28.0 | 29.0 | ||||
| San Diego | 3.0 | 3.3 | 3.2 | 15.0 | 13.0 | 14.0 | ||||
| Ventura | 4.6 | 4.9 | 4.9 | 47.0 | 45.0 | 43.0 | ||||
| Central Coast | ||||||||||
| Monterey | 4.1 | 4.6 | 4.4 | 22.0 | 21.0 | 24.0 | ||||
| San Luis Obispo | 3.9 | 3.8 | 4.5 | 22.0 | 21.0 | 23.5 | ||||
| Santa Barbara | 4.4 | 3.9 | 4.6 | 21.0 | 27.0 | 25.0 | ||||
| Santa Cruz | 4.2 | 3.6 | 3.1 | 22.5 | 16.0 | 13.0 | ||||
| Central Valley | ||||||||||
| Fresno | 3.0 | 3.1 | 3.1 | 16.0 | 15.0 | 13.0 | ||||
| Glenn | 5.4 | 5.2 | 4.3 | 19.5 | 23.0 | r | 20.0 | |||
| Kern | 2.5 | 2.9 | 3.1 | 18.0 | 14.0 | r | 20.0 | |||
| Kings | 3.5 | 2.9 | 3.0 | 26.5 | 19.0 | r | 22.5 | |||
| Madera | 4.3 | 4.2 | 5.1 | 20.0 | 25.0 | 27.0 | ||||
| Merced | 3.3 | 3.9 | 2.9 | 29.0 | 24.0 | r | 25.0 | |||
| Placer | 2.7 | 2.7 | 2.9 | 16.5 | 12.0 | r | 14.5 | |||
| Sacramento | 2.2 | 2.4 | 2.6 | 11.0 | 11.0 | r | 12.0 | |||
| San Benito | 3.3 | 3.2 | 3.3 | 28.0 | 28.5 | r | 12.5 | |||
| San Joaquin | 3.0 | 3.1 | 2.8 | 18.0 | 17.0 | r | 15.0 | |||
| Stanislaus | 2.5 | 2.9 | 3.2 | 15.0 | 11.0 | r | 16.0 | |||
| Tulare | 3.4 | 3.1 | 3.4 | 28.0 | 29.0 | r | 23.0 | |||
| Other Calif. Counties | ||||||||||
| Amador | 8.3 | 5.0 | r | NA | 33.5 | 25.0 | r | 30.0 | r | |
| Butte | 2.8 | 2.9 | 3.4 | 12.0 | 10.0 | 18.0 | ||||
| Calaveras | 5.6 | 6.7 | 5.9 | 36.5 | 33.0 | 40.0 | ||||
| Del Norte | 9.5 | 8.7 | 6.1 | 178.0 | 84.5 | 82.0 | ||||
| El Dorado | 4.9 | 5.3 | 3.7 | 36.0 | 24.0 | 28.0 | ||||
| Humboldt | 4.7 | 5.0 | 5.7 | 18.0 | 17.5 | 19.0 | ||||
| Lake | 5.4 | 6.4 | 6.3 | 39.5 | 37.0 | 38.0 | ||||
| Lassen | 6.9 | 6.3 | 5.8 | 72.0 | 66.0 | 93.0 | ||||
| Mariposa | 9.2 | 7.7 | 8.2 | r | 36.0 | 21.5 | 49.0 | r | ||
| Mendocino | 8.2 | 7.6 | 7.8 | 60.0 | 66.0 | 59.5 | ||||
| Mono | 11.5 | 8.2 | 9.1 | 76.0 | 102.5 | 78.5 | ||||
| Nevada | 5.6 | 5.4 | 4.6 | 18.0 | 19.0 | 23.0 | ||||
| Plumas | 11.8 | 10.9 | 8.7 | 73.0 | 123.0 | 66.0 | ||||
| Shasta | 4.4 | 4.8 | 4.5 | 23.0 | 21.0 | 18.0 | ||||
| Siskiyou | 6.2 | 8.1 | 6.8 | 42.0 | 38.0 | 32.0 | ||||
| Sutter | 2.5 | 2.9 | 3.5 | 14.0 | 14.0 | 15.0 | ||||
| Tehama | 5.0 | 5.6 | 7.5 | 48.0 | 36.0 | 38.0 | ||||
| Tuolumne | 6.7 | 7.9 | 5.1 | 23.0 | 32.0 | 22.0 | ||||
| Yolo | 2.6 | 2.6 | 2.7 | 14.0 | 12.5 | 11.0 | ||||
| Yuba | 3.2 | 3.0 | 2.6 | 14.0 | 9.0 | 13.0 | ||||
rNA = not available
Services we offer:
Bay Area
East Bay Area
West Contra Costa
Central Contra Costa
East Contra Costa
Alamo
American Canyon Central
Antioch
Bay Point
Benicia
Berkeley
Canyon Central Contra Costa
Castro Valley
Danville
Dublin
East Contra Costa
Emeryville
Fairfield
Hayward
Hercules
Lamorinda
Marin
Napa
Novato
Oakland
Pittsburg
Pleasanton
Port Costa
Richmond
Rodeo
San Francisco
San Leandro
San Pablo
San Rafael
San Ramon
Solano
Sonoma
Vallejo


Professional Property Management and Professional Property Management symbol are registered service marks of Professional Property Management. Professional Property Management fully supports the principles of the Fair Housing Act and the Equal Opportunity Act.
All information deemed reliable but not guaranteed. Listings are subject to errors, omissions, changes in price, prior sale, rent & withdrawal without notice. All Rights Reserved.
The design of this website and its contents are protected by copyright and any unauthorized reproduction, whether in whole or in part, is prohibited.