
VOTED "BEST PROPERTY MANAGEMENT COMPANY"
WHAT IS THE CURRENT MARKET CONDITIONS TO SELL MY PROPERTY?
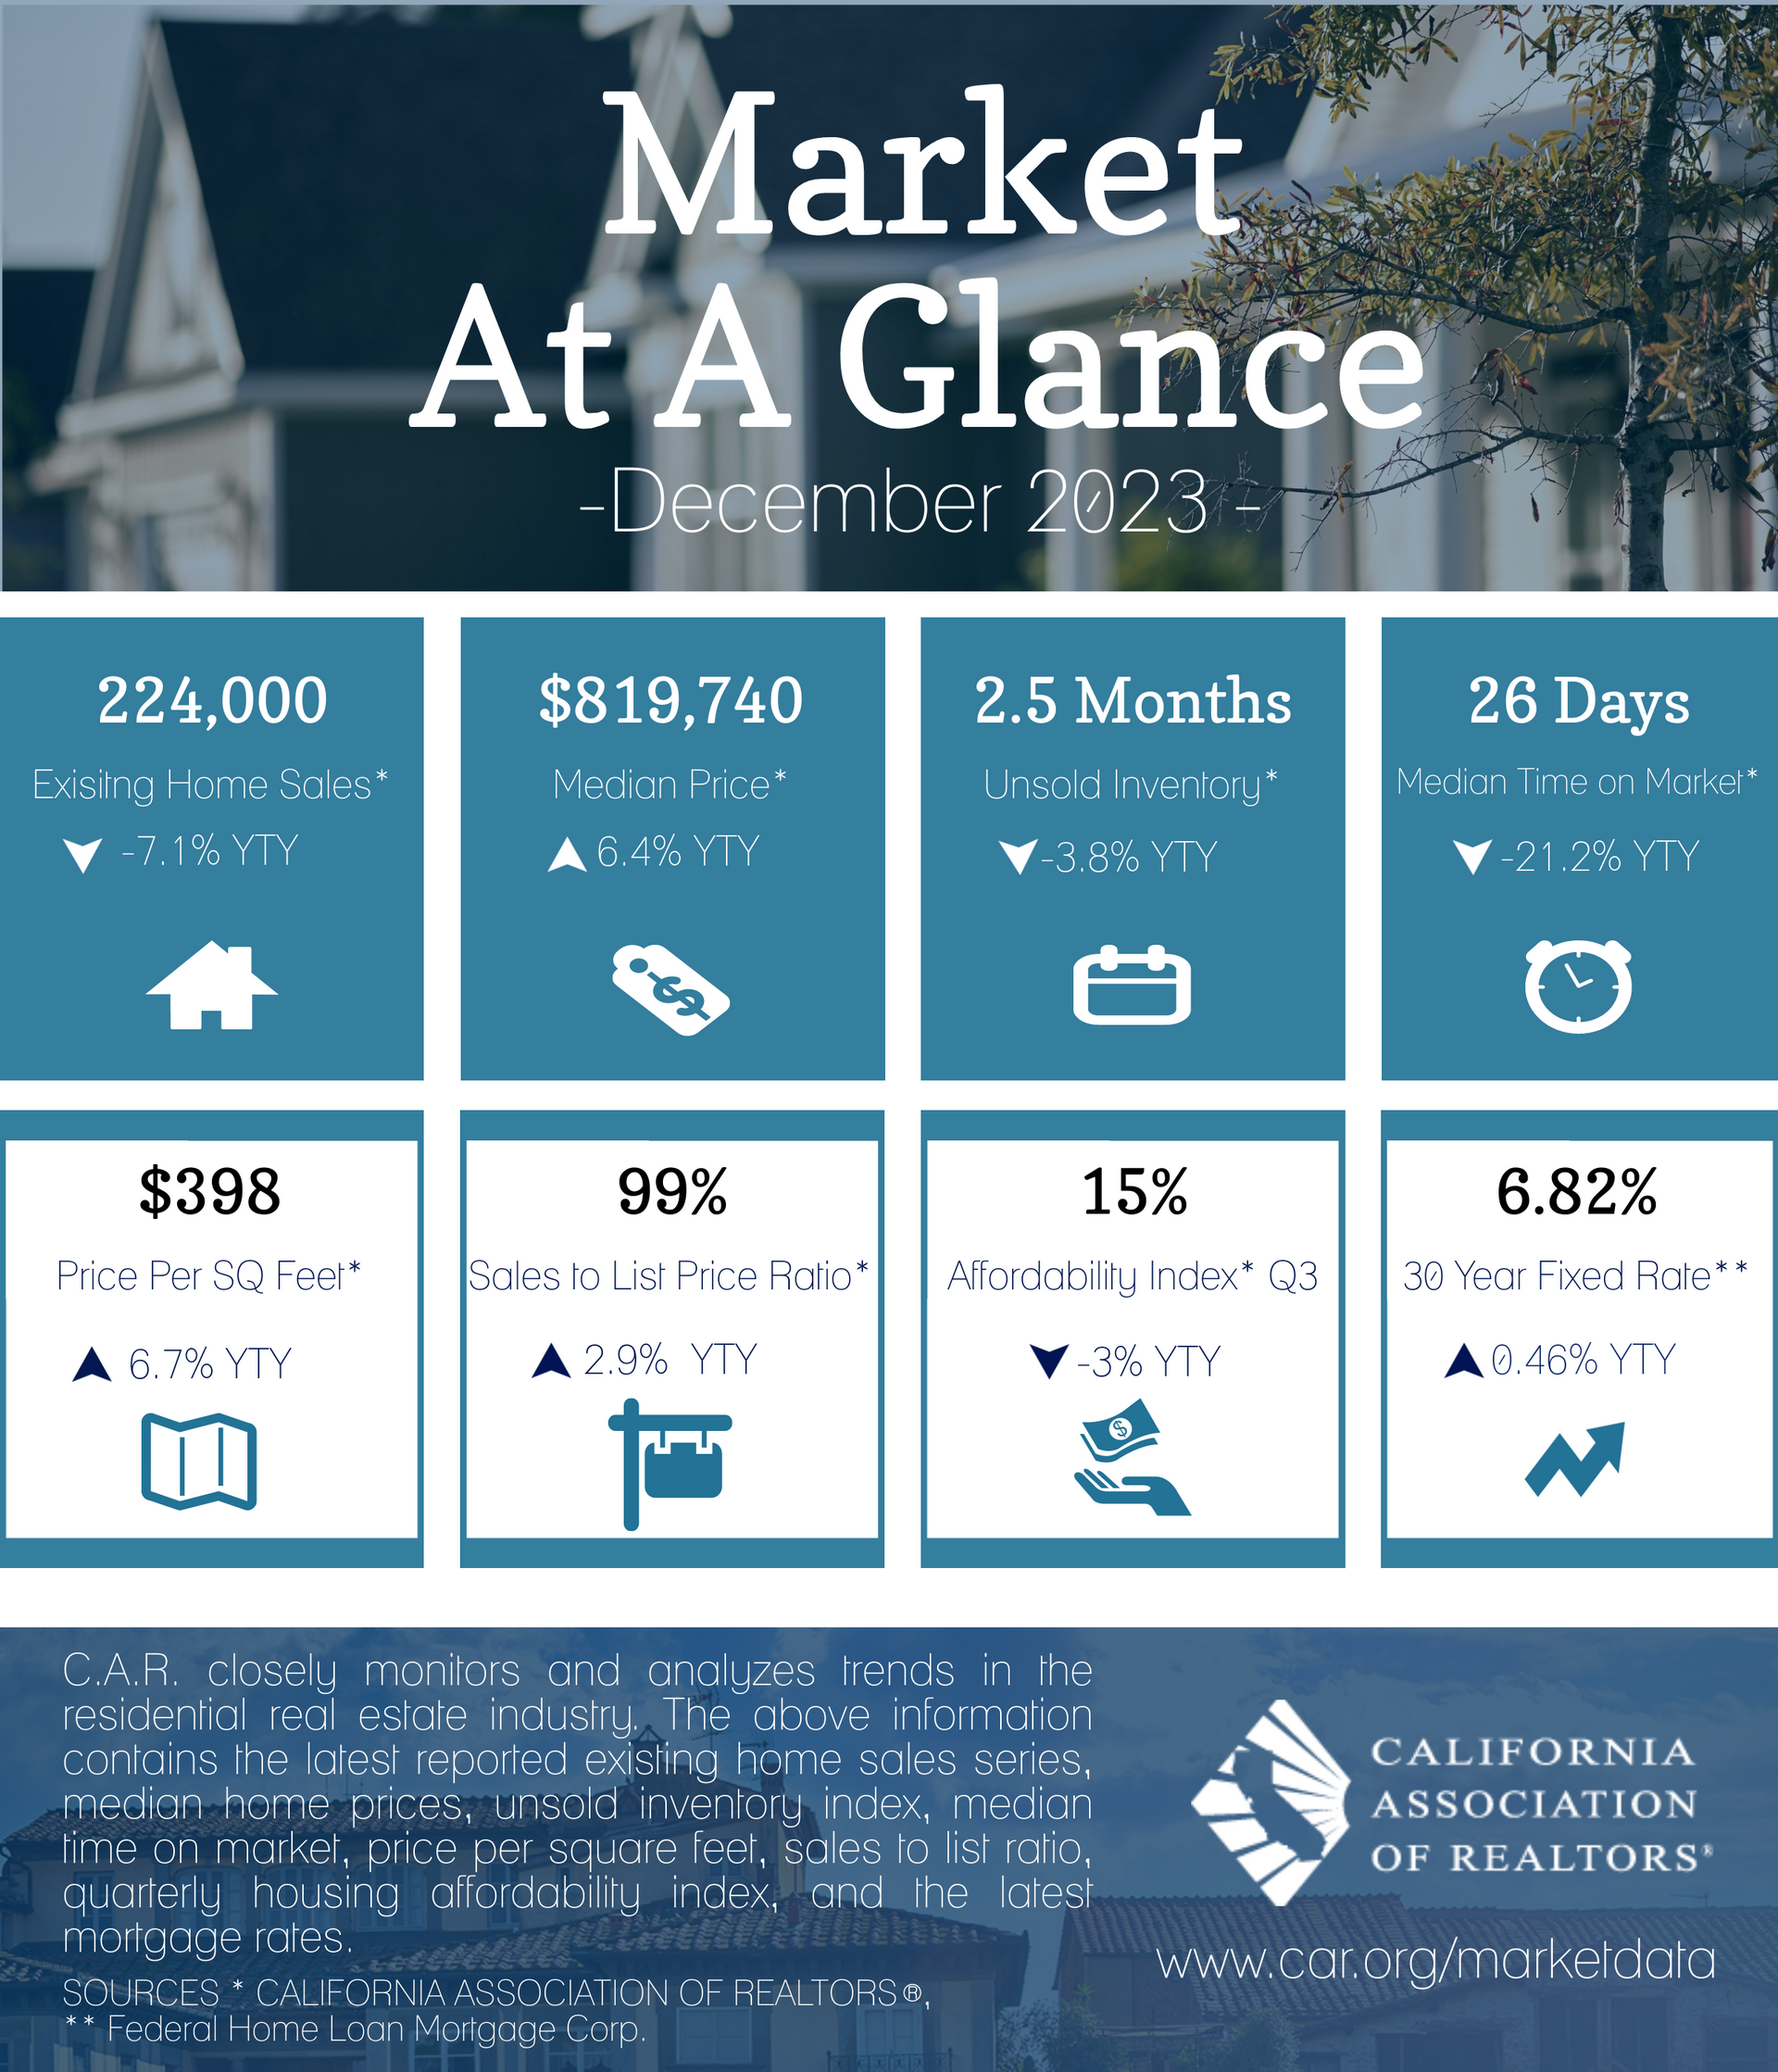
The Market at a Glance
| April-19 | Median Sold Price of Existing Single-Family Homes | Sales | ||||||||
| State/Region/County | Apr-19 | Mar-19 | Apr-18 | Price MTM% Chg | Price YTY% Chg | Sales MTM% Chg | Sales YTY% Chg | |||
| CA SFH (SAAR) | $602,920 | $565,880 | $584,460 | 6.5% | 3.2% | -0.1% | -4.8% | |||
| CA Condo/Townhomes | $470,000 | $465,000 | $471,500 | r | 1.1% | -0.3% | 13.4% | -3.8% | ||
| Los Angeles Metropolitan Area | $536,450 | $517,000 | $515,000 | 3.8% | 4.2% | 13.9% | -2.0% | |||
| Central Coast | $699,450 | $645,000 | $661,750 | 8.4% | 5.7% | 5.6% | -4.1% | |||
| Central Valley | $330,730 | $325,000 | $325,000 | 1.8% | 1.8% | 10.1% | -0.4% | |||
| Inland Empire | $378,240 | $374,900 | $360,000 | 0.9% | 5.1% | 6.8% | -7.0% | |||
| S.F. Bay Area | $988,000 | $940,000 | $1,010,000 | r | 5.1% | -2.2% | 17.8% | -1.0% | ||
| S.F. Bay Area | Apr-19 | Mar-19 | Apr-18 | Price MTM% Chg | Price YTY% Chg | Sales MTM% Chg | Sales YTY% Chg | |||
| Alameda | $940,000 | $911,000 | $969,300 | 3.2% | -3.0% | 20.4% | 2.4% | |||
| Contra Costa | $679,000 | $644,000 | $689,660 | 5.4% | -1.5% | 11.8% | -4.8% | |||
| Marin | $1,350,000 | $1,300,000 | $1,385,000 | 3.8% | -2.5% | 44.9% | 2.9% | |||
| Napa | $705,000 | $699,000 | $682,500 | 0.9% | 3.3% | 44.6% | 0.0% | |||
| San Francisco | $1,632,500 | $1,637,500 | $1,650,000 | -0.3% | -1.1% | 27.1% | 16.1% | |||
| San Mateo | $1,601,000 | $1,610,000 | $1,770,000 | -0.6% | -9.5% | 22.5% | 10.4% | |||
| Santa Clara | $1,315,000 | $1,300,000 | $1,425,000 | 1.2% | -7.7% | 12.1% | -8.4% | |||
| Solano | $435,000 | $438,500 | $447,500 | -0.8% | -2.8% | 4.8% | -0.5% | |||
| Sonoma | $645,000 | $633,750 | $685,000 | 1.8% | -5.8% | 29.0% | -2.0% | |||
| Southern California | Apr-19 | Mar-19 | Apr-18 | Price MTM% Chg | Price YTY% Chg | Sales MTM% Chg | Sales YTY% Chg | |||
| Los Angeles | $544,170 | $525,520 | $528,550 | 3.5% | 3.0% | 18.2% | -0.1% | |||
| Orange | $825,000 | $809,500 | $818,000 | 1.9% | 0.9% | 17.1% | 0.5% | |||
| Riverside | $423,000 | $412,000 | $400,000 | 2.7% | 5.8% | 7.4% | -6.5% | |||
| San Bernardino | $305,000 | $309,950 | $289,900 | -1.6% | 5.2% | 5.8% | -7.7% | |||
| San Diego | $649,000 | $623,800 | $635,000 | 4.0% | 2.2% | 13.7% | 2.4% | |||
| Ventura | $650,000 | $640,000 | $665,000 | 1.6% | -2.3% | 27.8% | 15.2% | |||
| Central Coast | Apr-19 | Mar-19 | Apr-18 | Price MTM% Chg | Price YTY% Chg | Sales MTM% Chg | Sales YTY% Chg | |||
| Monterey | $600,000 | $579,000 | $607,750 | 3.6% | -1.3% | 11.9% | -4.7% | |||
| San Luis Obispo | $650,000 | $629,500 | $597,505 | 3.3% | 8.8% | 9.5% | 3.5% | |||
| Santa Barbara | $760,500 | $555,000 | $650,000 | 37.0% | 17.0% | -8.9% | -4.0% | |||
| Santa Cruz | $977,750 | $918,000 | $899,000 | 6.5% | 8.8% | 15.4% | -15.0% | |||
| Central Valley | Apr-19 | Mar-19 | Apr-18 | Price MTM% Chg | Price YTY% Chg | Sales MTM% Chg | Sales YTY% Chg | |||
| Fresno | $271,250 | $280,000 | $260,000 | -3.1% | 4.3% | 6.1% | -6.5% | |||
| Glenn | $241,250 | $250,000 | $215,000 | -3.5% | 12.2% | -18.5% | 69.2% | |||
| Kern | $250,000 | $249,950 | $235,000 | 0.0% | 6.4% | 12.9% | 16.0% | |||
| Kings | $240,000 | $232,000 | $235,000 | 3.4% | 2.1% | -10.5% | -23.8% | |||
| Madera | $271,950 | $265,000 | $244,000 | 2.6% | 11.5% | 43.7% | 18.8% | |||
| Merced | $276,000 | $275,000 | $259,000 | 0.4% | 6.6% | 22.5% | 22.5% | |||
| Placer | $498,500 | $475,000 | $489,000 | 4.9% | 1.9% | 13.1% | -4.7% | |||
| Sacramento | $385,000 | $365,000 | $369,000 | 5.5% | 4.3% | 12.2% | -6.8% | |||
| San Benito | $550,900 | $610,000 | $569,217 | -9.7% | -3.2% | 32.5% | -10.2% | |||
| San Joaquin | $375,000 | $355,000 | $374,990 | 5.6% | 0.0% | 11.2% | 6.9% | |||
| Stanislaus | $319,500 | $320,000 | $306,000 | -0.2% | 4.4% | 7.1% | 1.1% | |||
| Tulare | $244,950 | $230,000 | $229,250 | 6.5% | 6.8% | -7.5% | 4.1% | |||
| Other Counties in California | Apr-19 | Mar-19 | Apr-18 | Price MTM% Chg | Price YTY% Chg | Sales MTM% Chg | Sales YTY% Chg | |||
| Amador | NA | NA | $335,000 | NA | NA | NA | NA | |||
| Butte | $360,000 | $369,000 | $316,000 | -2.4% | 13.9% | -27.3% | -4.3% | |||
| Calaveras | $340,000 | $308,250 | $340,000 | 10.3% | 0.0% | -5.4% | -10.3% | |||
| Del Norte | $216,500 | $253,025 | $239,000 | -14.4% | -9.4% | 90.0% | -17.4% | |||
| El Dorado | $524,000 | $506,165 | $499,999 | 3.5% | 4.8% | -1.3% | -20.2% | |||
| Humboldt | $305,000 | $310,000 | $309,000 | -1.6% | -1.3% | 0.9% | -1.7% | |||
| Lake | $262,400 | $243,500 | $285,000 | 7.8% | -7.9% | 18.0% | -24.4% | |||
| Lassen | $200,950 | $220,000 | $155,500 | -8.7% | 29.2% | -4.8% | 33.3% | |||
| Mariposa | $286,500 | $277,500 | $344,850 | 3.2% | -16.9% | 20.0% | -29.4% | |||
| Mendocino | $418,500 | $394,500 | $430,000 | 6.1% | -2.7% | 22.2% | 25.7% | |||
| Mono | $717,250 | $800,000 | $520,000 | -10.3% | 37.9% | 433.3% | 128.6% | |||
| Nevada | $397,000 | $412,500 | $408,738 | -3.8% | -2.9% | 1.6% | 12.7% | |||
| Plumas | $395,000 | $287,500 | $280,250 | 37.4% | 40.9% | 0.0% | 116.7% | |||
| Shasta | $275,000 | $285,000 | $258,950 | -3.5% | 6.2% | -1.9% | 0.0% | |||
| Siskiyou | $208,500 | $205,000 | $217,250 | 1.7% | -4.0% | -2.2% | 29.4% | |||
| Sutter | $305,000 | $310,000 | $280,000 | -1.6% | 8.9% | 11.5% | -9.3% | |||
| Tehama | $232,500 | $315,000 | $210,000 | -26.2% | 10.7% | -6.1% | 12.2% | |||
| Tuolumne | $316,000 | $315,000 | $305,000 | 0.3% | 3.6% | 18.0% | -15.3% | |||
| Yolo | $419,330 | $450,000 | $495,000 | -6.8% | -15.3% | 21.8% | -8.8% | |||
| Yuba | $268,000 | $290,000 | $285,000 | -7.6% | -6.0% | 1.4% | -6.3% | |||
| Note: The MLS median price and sales data in the table below are generated from a survey of more than 90 associations of REALTORS® throughout the state, and represent statistics of existing single-family detached homes only. sales data are not adjusted to account for seasonal factors that can influence home sales. Movements in sales prices should not be interpreted as changes in the cost of a standard home. Median prices can be influenced by changes in cost, as well as changes in the characteristics and the size of homes sold. Due to the low sales volume in some areas, median price changes may exhibit unusual fluctuation. | ||||||||||
Services we offer:
Bay Area
East Bay Area
West Contra Costa
Central Contra Costa
East Contra Costa
Alamo
American Canyon Central
Antioch
Bay Point
Benicia
Berkeley
Canyon Central Contra Costa
Castro Valley
Danville
Dublin
East Contra Costa
Emeryville
Fairfield
Hayward
Hercules
Lamorinda
Marin
Napa
Novato
Oakland
Pittsburg
Pleasanton
Port Costa
Richmond
Rodeo
San Francisco
San Leandro
San Pablo
San Rafael
San Ramon
Solano
Sonoma
Vallejo


Professional Property Management and Professional Property Management symbol are registered service marks of Professional Property Management. Professional Property Management fully supports the principles of the Fair Housing Act and the Equal Opportunity Act.
All information deemed reliable but not guaranteed. Listings are subject to errors, omissions, changes in price, prior sale, rent & withdrawal without notice. All Rights Reserved.
The design of this website and its contents are protected by copyright and any unauthorized reproduction, whether in whole or in part, is prohibited.